 ;
;

To support users in efficiently evaluating digital sensor data, Arup has designed and developed Global Analyzer. An on-line service enabling users to log into a secure website and easily navigate through a selection of sensors and instruments to access instantly prepared and updated plots of data, visualised within their geographical context.
Additional functionality includes downloading raw and interpreted data for further processing, as well as uploading any associated documents and reports.
An early warning system has also been integrated into the system to prevent possible issues relating to data interpretation. These alerts are built in and sent to project engineers when a sensor value has exceeded a predefined trigger value.
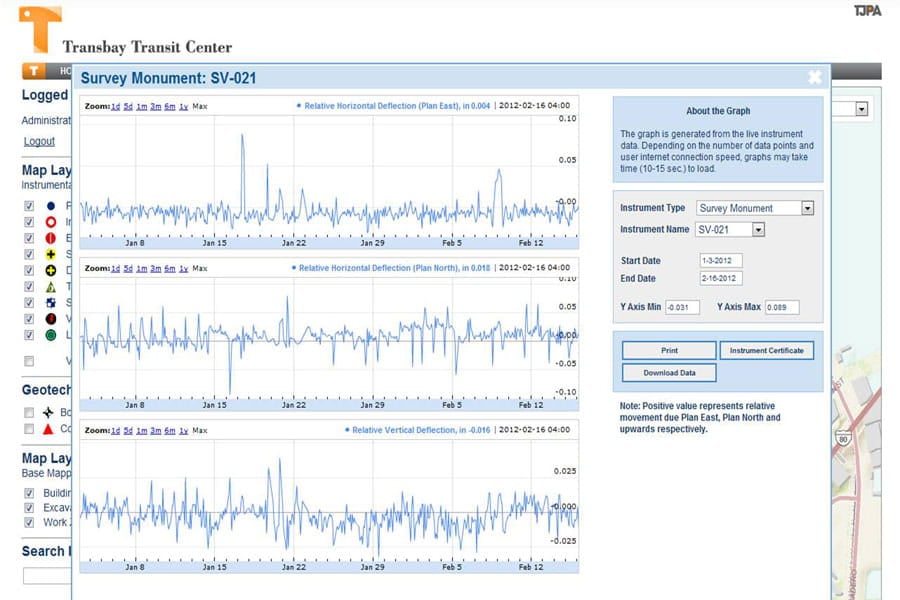
Transbay Transit Centre
Arup is using Global Analyzer to monitor the 480,000 m3 excavation for the Transbay Transit Center in downtown San Francisco. The Transbay Transit Centre will be San Francisco’s premiere transportation hub.
To monitor the excavation Arup is using a network of over 2000 digital sensors which are connected to Global Analyzer. All of this information is available through a dynamic map. The sensor readings are used to power realtime graphs and to enable real time monitoring of the site.
How Global Analyzer works
Digital sensor data instruments are displayed in their real world position, presented through an online Geographic Information System (GIS). A simple mouse click on an instrument provides access to a fully dynamic live graphs and other digital data visualisation tools.
All of the digital sensor are connected and configured to Global Analyzer to provide live data updates. The data is stored and managed in a relational geo-database.
Benefits
-
Live reporting: data is reported live in real time. This provides an efficient method for optimizing reporting and monitoring.
-
Mitigating risk: potential issues can be flagged in near real time, as they occur. There is no lag to process and visualize the data.
-
A managed audit trail: all of the instrumentation data is stored within a highly-resilient database.
-
Asset management foundation: the service can easily be used as the basis for asset management and for further monitoring.
-
Access to third parties and other stakeholders can be provided through the password-protected portal on the cloud.
Application
Global Analyzer can be used in any situation where a combination of digital sensor monitors are being used. The benefit of Global Analyzer is that it is able to combine data feeds within a single common interface. Instruments are accessed geographically through a dynamic map. This provides geographical context to the data and its related surroundings.